

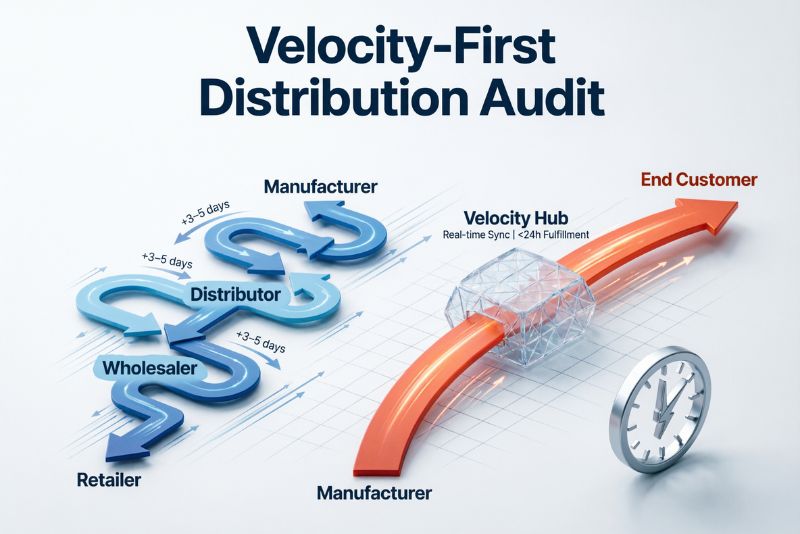
The earlier blog post (Click here if you missed it) warned you: distribution is a magnifier, not a growth strategy. A product with weak velocity becomes extinct faster the more doors you open. This audit operationalises that warning. In under 30 minutes you will score your brand’s readiness for retail expansion across the seven dimensions that matter most—velocity data, listing costs, cash flow, store qualification, content readiness, operational capacity, and delisting risk—and learn whether your next expansion move will build your business or quietly drain your bank account.
How to use this audit:
For each of the seven questions, read the expanded explanation carefully.
- Honestly score your current capabilities on the 1‑to‑5 scale provided.
- Tally your total score and use the Scoring Summary to determine your Distribution Readiness Level.
- Focus your next 90 days on the lowest‑scoring questions first.
The full Velocity-First Distribution Toolkit—which includes a cash‑flow projection template, a store‑qualification scorecard, and a delisting early‑warning tracker—is available for purchase. But the diagnostic below will tell you where you stand today.
The Seven Diagnostic Questions
Disclaimer
This Velocity-First Distribution Audit, including all diagnostic questions, expanded explanations, scoring rubrics, and the risk interpretation summary, is provided for informational and educational purposes only. It does not constitute professional business, financial, legal, or accounting advice.
The scoring system and readiness classifications are designed as a self‑assessment framework to help FMCG brands evaluate their preparedness for retail expansion. They are not a substitute for a formal financial audit, professional cash‑flow analysis, or consultation with qualified accountants, logistics professionals, or retail strategists. Every business has unique circumstances, cost structures, market conditions, and retailer relationships that may not be fully captured by this generic diagnostic tool.
Cash‑Flow and Financial Modelling: The cash‑gap analysis is a simplified model. Actual cash‑flow dynamics depend on specific payment terms, retailer deduction practices, promotional commitments, and supply‑chain lead times. Users should build detailed, scenario‑tested models in consultation with their finance team or external advisors before committing to significant distribution expansion.
Data Sources and Benchmarks: The USPW thresholds and listing‑fee ranges referenced are based on publicly available information and general industry patterns in Malaysia. They may vary significantly by category, retailer, and geography. Users should validate these against their own category and retail partner data.
The author and publisher make no representations or warranties, express or implied, regarding the accuracy, completeness, or suitability of the information contained in this audit. To the fullest extent permitted by law, the author and publisher disclaim all liability for any loss, damage, or expense—financial or otherwise—arising from reliance on this material.
By using this audit, you acknowledge that you have read and understood this disclaimer. If you are uncertain about your brand’s financial or operational readiness for retail expansion, consult a qualified professional immediately. A poorly timed expansion can be fatal.
Question 1: USPW Baseline
The Question: Do I have at least six months of velocity data (units per store per week) from my current stores, and is that velocity stable or climbing—not declining?
Expanded Explanation:
Units Per Store Per Week (USPW) is the single most important health metric for a small FMCG brand. It measures how fast your product actually sells where it is available. Without a six‑month baseline, you cannot distinguish a genuine growth trend from a temporary spike caused by a promotion or a new listing. A declining USPW is a screaming alarm that your product is losing relevance or that you are already in too many low‑quality stores. Expanding distribution when USPW is falling is the equivalent of adding more lanes to a road that nobody is driving on. You must know your number, broken down by store tier, and you must know whether that number is getting better or worse.
Scoring Rubric:
1: I do not track USPW at all. I measure success by total monthly invoiced volume.
2: I occasionally check sell‑out data from one or two retailers, but I have no consistent tracking or trend analysis.
3: I track USPW for my top 20 stores, but the data is patchy for smaller accounts and I have not formally analysed the trend line.
4: I maintain a rolling 12‑month USPW dashboard for all stores, segmented by channel and geography. The trend line is reviewed monthly by the sales team.
5: USPW data is live (or as close to real‑time as my systems allow), segmented to store level, and directly linked to a traffic‑light system that triggers action when velocity falls below target. No new distribution is approved without a USPW sign‑off from the Head of Sales
Question 2: Listing Cost Per Store
The Question: Have I calculated the fully loaded cost of entering one new store—listing fees, free fills, promotional allowances, logistics, merchandising, and ongoing deductions—not just the per‑unit COGS?
Expanded Explanation:
The cost of distribution is never just the cost of goods. It is an iceberg. Above the waterline is the per‑unit COGS. Below it are listing fees (RM1,000‑RM25,000+ per SKU per chain in Malaysia), slotting allowances, free‑fill cases you give away to seed the shelf, promotional discounts you are required to fund, co‑op advertising contributions, rebates, compliance penalties for late deliveries, and the incremental logistics cost of delivering one more store. If you have not calculated the fully loaded first‑year cost of opening a single new door, you are approving expansion blind. Many brands discover, too late, that the listing fees and free fills alone consumed the entire first‑year gross profit from that store.
Scoring Rubric:
1: I have never calculated a fully loaded per‑store entry cost. I assume it will be covered by sales.
2: I have a rough mental estimate of listing fees, but I have not formally added free fills, promotional commitments, or logistics.
3: I built a per‑store cost model once, but it is not updated with actual deductions or used as a gate before signing new distribution agreements.
4: A fully loaded per‑store P&L model exists for each major retail chain and channel type. It is used to evaluate every new store entry and is updated quarterly with actual deduction data.
5: The per‑store cost model is automated and fed by actual trade spend data. Every proposed new door is stress‑tested against three scenarios (optimistic, realistic, pessimistic) before a purchase order is accepted.
Question 3: Cash Gap Analysis
The Question: Do I have sufficient cash reserves to fund the gap between production outflow and retailer payment for the full payment term, for every new store I enter?
Expanded Explanation:
FMCG is a negative‑working‑capital business for the strong, and a cash‑burn machine for the unprepared. You pay your co‑packer upfront or on Net 30 terms. You pay for packaging and raw materials before a single jar is filled. You pay listing fees on signature. You ship the product. Then you wait—typically 60 to 90 days in Malaysia—for the retailer to pay you. That gap between cash out (production, listing, logistics) and cash in (retailer payment) must be funded from your own reserves. Expanding quickly without modelling this gap is the single most common cause of sudden FMCG insolvency. You need to know, for each new store or chain, exactly how much cash will be locked up and for how long, and whether your reserves can survive it.
Scoring Rubric:
1: I do not model the cash‑flow gap. I track my bank balance and hope it stays positive.
2: I have a rough cash‑flow forecast, but it does not link specific store entries to payment‑term delays.
3: I build a basic cash‑flow model for major chain expansions, but it is not updated monthly with actual payment timings.
4: I maintain a 12‑month cash‑flow forecast that explicitly links every new store entry to its associated listing cost, production outlay, and expected payment receipt. It is reviewed monthly with finance.
5: My cash‑flow model triggers an automatic alert if reserves fall below the level required to fund the next three months of confirmed distribution commitments. I have a pre‑approved contingency (spend freeze, invoice factoring, or delayed expansion) that activates at defined thresholds.
Question 4: Store Qualification
The Question: Have I reviewed the specific store list proposed by the distributor or retailer and filtered out locations where foot traffic, demographics, or competitive density make success unlikely?
Expanded Explanation:
Not all stores are equal. A 99 Speedmart in a high‑density B40 suburb next to an LRT station will generate very different velocity than one in a quiet rural taman with low footfall and a demographic that cannot afford your premium price point. Distributors and retail chains are incentivised to maximise the number of doors they open—they earn margin on sell‑in volume, not sell‑through velocity. If you accept their entire store list without qualification, you will end up with product sitting on shelves in stores where the customer base simply does not match your product. Each of those low‑velocity stores costs you listing fees, inventory, and—ultimately—a delisting that damages your reputation with the chain’s head office. You must qualify every store.
Scoring Rubric:
1: I accept whatever store list the distributor or retailer gives me. I have no qualification criteria.
2: I informally flag obviously unsuitable stores (e.g., rural locations for a premium product), but I have no documented qualification framework.
3: I use a basic set of criteria (e.g., minimum foot traffic, presence of competitor brands) but do not systematically score every store.
4: I maintain a store‑qualification scorecard that filters potential doors by foot traffic, catchment demographics, competitive density, and historical velocity of comparable stores. Only stores above a threshold score are approved.
5: My store‑qualification model is data‑driven, using actual retailer catchment data (where available) or reliable proxies. It is continuously refined based on actual vs. predicted velocity. I regularly de‑list my own products from stores that fail to meet the threshold after a defined trial period.
Question 5: Content Readiness
The Question: Does my brand have a searchable, permanent content library that a consumer in a new store can find when they encounter my product for the first time?
Expanded Explanation:
In the moment a shopper sees your product on the shelf for the first time, she has about five seconds to decide whether to pick it up. If she does not recognise the brand, she will pull out her phone and search for it. If she finds nothing—no product demo, no recipe video, no reviews, no founder story—she puts the product back. Your offline shelf presence is a billboard. Your online content is the salesperson who closes the deal. Expanding into stores without a content library means you are paying listing fees for a billboard with no salesperson standing next to it. Before you add a single new door, you need a permanent, search‑optimised library that answers every question a curious shopper might type into Google or TikTok.
Scoring Rubric:
1: I have no content library. My social media is mostly static posts that disappear from the feed within 48 hours.
2: I have a few product photos and maybe one launch video, but no organised library of usage, recipe, review, or FAQ content.
3: I have a modest content library (5‑10 pieces), but it is not systematically organised, search‑optimised, or linked from product pages.
4: I maintain a content library with at least three pieces of permanent content per hero SKU (demo video, recipe/usage article, customer review compilation). Content is search‑optimised and easily discoverable from the product page and a Google search of my brand name.
5: My content library is a strategic asset: 20+ pieces per SKU covering product demos, recipes, UGC, FAQs, and behind‑the‑scenes stories. It is continuously updated, SEO‑optimised, and directly attributed to a measurable percentage of trial and repeat purchases. New store expansion is gated on content library completeness for the SKUs being distributed.
Question 6: Operational Capacity
The Question: Can my current logistics, merchandising, and account management team handle the increased store count without breaking? If I do not have a dedicated retail operations person yet, what is my plan to hire one?
Expanded Explanation:
Moving from 50 stores to 300 is not just more sales. It is a completely different operational animal. You are now managing multiple distributors, each with their own delivery windows, margin structures, and reporting formats. You need a merchandising force (or a reliable third‑party merchandising agency) to ensure your product is actually on the shelf, properly faced, and not buried in the back room. You need an account manager to handle retailer deductions, compliance queries, and promotional calendar alignment. If your current “operations team” is the founder and a part‑time assistant, adding 200 stores will break them—and your service levels, fill rates, and retailer relationships will collapse. You must assess whether your operational backbone is strong enough for the load you are about to place on it.
Scoring Rubric:
1: Operations are handled by the founder or a single generalist. There is no dedicated logistics, merchandising, or account management role.
2: We have a small operations team, but they are already stretched. There is no plan to add capacity before expanding distribution.
3: We have identified the key roles needed (e.g., a merchandising agency, a retail account manager) but have not yet hired or contracted them.
4: A dedicated retail operations function exists with defined roles, KPIs, and capacity planning. Headcount is added in line with distribution expansion targets, with a lead time of at least three months.
5: Operations capacity is modelled alongside distribution expansion. We use a flexible mix of in‑house and outsourced (3P merchandising) resources. Service levels (fill rate, on‑time delivery, shelf compliance) are tracked and maintained above 95% even during expansion waves.
Question 7: Delisting Risk Awareness
The Question: Have I identified my weakest‑performing stores and built a proactive plan to improve velocity before the buyer initiates the delisting conversation?
Expanded Explanation:
Delisting is not a sudden, unpredictable event. It is the end of a slow, visible decline. The category buyer tracks your USPW. When it falls below the threshold for the category (often 1.0‑2.0 units per store per week for many packaged food categories in Malaysia), your product enters the “watch list.” If you are not also tracking your USPW, the delisting notice arrives as a shock. If you are tracking it, you can act—increase in‑store promotion, deploy a guerrilla demo, renegotiate shelf placement, or even proactively withdraw the product from that store and redeploy inventory to a higher‑velocity location. Proactive delisting management turns a defensive crisis into an offensive resource reallocation.
Scoring Rubric:
1: I have no system to identify weak‑performing stores. I find out about delistings when the purchase orders stop.
2: I react to buyer warnings when they come, but I have no proactive list of at‑risk stores or a pre‑planned intervention playbook.
3: I review velocity by store quarterly and flag stores below a certain threshold, but interventions are inconsistent.
4: I maintain a live “at‑risk store” register. Every store below the category velocity threshold has a documented 90‑day improvement plan. Results are tracked, and stores that do not recover are proactively exited to preserve the relationship with the chain’s head office.
5: Delisting risk management is a core retail operations process. I use predictive analytics to identify stores likely to fall below threshold within the next two quarters. Proactive interventions are standardised and cost‑justified. My delisting rate is the lowest in my category, and my buyer relationships are strengthened by my proactive, data‑led approach.
Get the Full Velocity-First Distribution Toolkit
The seven questions above are the diagnostic. The full Velocity-First Distribution Toolkit (available for purchase) provides the prescription:
USPW Tracker Template – an Excel dashboard for tracking velocity by store, region, and channel, with a traffic‑light alert system.
Fully Loaded Store P&L Calculator – a model that captures listing fees, free fills, promotional deductions, logistics, and ongoing trade spend to calculate first‑year profitability per store.
Cash‑Flow Projection Tool – a 12‑month cash‑flow modeller that links distribution expansion to working‑capital requirements.
Store Qualification Scorecard – a weighted scoring template for evaluating potential new doors against demographic, foot‑traffic, and competitive criteria.
Content Library Readiness Checklist – an expanded version of the Stock Content Library Audit, tailored for brands about to enter physical retail.
Delisting Early‑Warning Tracker – a system for flagging at‑risk stores and deploying pre‑built intervention playbooks.
[Purchase the Full Velocity-First Distribution Toolkit Here]
Distribution is not validation. It is a magnifier. It makes a product with strong velocity stronger and a product with weak velocity extinct. This audit tells you which one you are.
